How Area School Districts Compare
WINNSBORO – A major talking point Fairfield County education leaders have been making about the 2018 state report cards is that no Fairfield school rated Unsatisfactory.
“We were competitive,” said Dr. J.R. Green, district superintendent, said of the results at a recent Board of Trustees meeting. “Virtually every district that adjoins Fairfield County had at least one unsatisfactory school.”
That ratio is actually closer to 50-50 for the six surrounding districts, with three districts reporting no Unsatisfactory schools and three others reporting at least one Unsatisfactory school. Union, Newberry and Lancaster counties didn’t report any Unsatisfactory schools, according to report card data. Chester, Kershaw and Richland Two reported at least one Unsatisfactory school.
Additionally, Green’s comparison includes some districts substantially larger than Fairfield County, which has seven schools, excluding the state-run Midlands Stem Institute which has two schools.
Chester has 13, Newberry has 14, Kershaw has 18 and Lancaster has 20. Richland Two is the largest adjoining district with 32 schools.
Fairfield
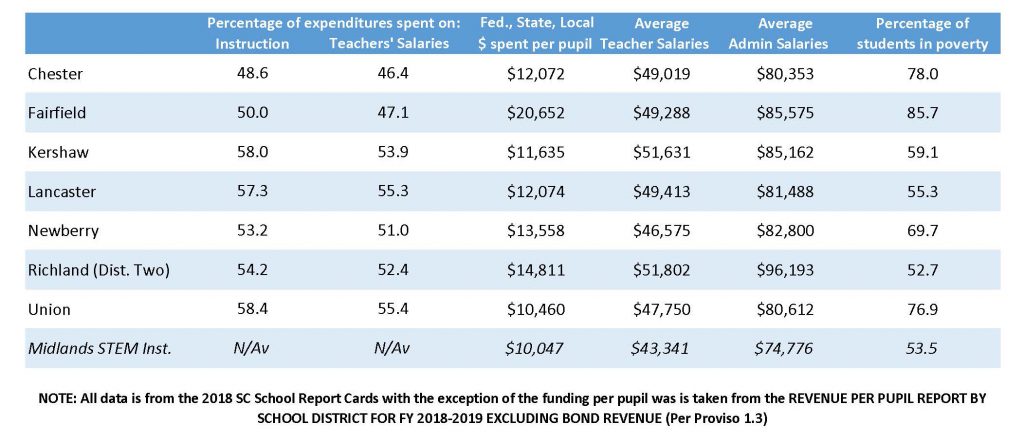
With the highest federal, state and local funding per pupil ($20,652), the highest percentage of students in poverty and the smallest average number of students per teacher ratio, Fairfield County had one school rated as Excellent, and another received a Good rating on the 2018 SC school report card. Three others were rated Average and two were rated Below Average. None were Unsatisfactory, the lowest rating.
Here’s a breakdown of how each school performed:
- Fairfield Magnet School for Math & Science (Excellent)
- Kelly Miller Elementary (Good)
- McCrorey-Liston Elementary (Average)
- Geiger Elementary (Average)
- Fairfield Central High School (Average)
- Fairfield Middle (Below Average)
- Fairfield Elementary (Below Average)
Chester
Chester, with the highest average student to teacher ratio (25.4 students per teacher), second highest percent of students in poverty (78.0) and third lowest average teacher salary ($49,018), struggled the most among the seven districts. Chester had one Excellent school, three Average schools, six Below Average schools and three schools receiving the state’s lowest rating of Unsatisfactory.
Kershaw
Aside from reporting one Unsatisfactory school, Kershaw’s 18 schools performed well, with five schools earning Good ratings, nine rated Average and three rated Below Average.
Lancaster
In Lancaster County, eight schools scored either Excellent or Good. Seven were rated Average and five received a rating of Below Average. Lancaster had no Unsatisfactory schools.
Newberry
Newberry County, with the lowest average pay for teachers ($46,575) of the seven districts, and the fourth highest percentage of students in poverty (69.7), reported three schools with Excellent ratings, five schools with a Good ranking, five schools with an Average rating and only one school with a Below Average rating, report card data shows. Newberry had no Unsatisfactory ratings.
Richland Two
In Richland Two, about one-third of schools (11) scored Good or Excellent on the report cards. Of the nine Blythewood area Richland Two schools, six were among the 11 top schools:
- Langford Elementary (Excellent)
- Round Top Elementary (Excellent)
- School for Knowledge Elementary – housed in Muller Road Middle (Excellent)
- Bethel-Hanberry Elementary (Good)
- Sandlapper Elementary (Good)
- Blythewood High (Good)
Westwood High, Blythewood Middle and Muller Road Middle (grades 6 – 8) schools received an Average rating,
The Center for Achievement elementary magnet school housed in the Kelly Mill Middle school, is the only Blythewood area school to receive an Unsatisfactory rating. Two other Richland Two schools also received Unsatisfactory ratings.
Union
Union County, which has eight schools, reported one Excellent school, six Average schools and one Below Average school. Union has the third highest percentage of students in poverty (76.9) and allocates the highest percentage (55.4) of its expenditures to teacher salaries which, at an average of $47,750, are the second lowest of the seven districts.
Midlands Stem Institute
The report cards list the Midlands Stem Institute, or MSI, of Winnsboro under the S.C. Public Charter School District. The state issued two report cards for the K-8 school – one for elementary grades and one for middle school grades:
- MSI, elementary (Below Average)
- MSI, middle (Average)
The school added ninth grade last fall which was not included in the 2018 ratings. MSI receives $10,047 in federal, state and local funding per pupil, about half the amount the Fairfield District receives and the least of any of the other seven comparison districts.
Comparing the seven districts
In 2018, the state revamped the report cards into two main categories: Academics and School Environment. There are six subcategories under Academics and four under School Environment.
At the Dec. 18 school board meeting, Green stated that the new report cards create a “forced distribution” of schools.
According to the model, only the top 15 percent of schools are rated Excellent. The next 20 percent receive a Good rating, while the middle 35 percent receive Average ratings.
Below Average schools make up the next 20 percent while the bottom 10 percent are Unsatisfactory.
“This system has negatively impacted all kinds of districts with all kinds of populations,” Green said at the meeting. “It creates a ‘Hunger Games’ mentality. Everyone is scrambling to the top and to reach the top.”
Class sizes
Fairfield County’s student to teacher ratio of 16.9 to 1 is the smallest [number of students per teacher] ratio compared to the six districts surrounding Fairfield.
Richland Two has the next lowest ratio at 19.7 to 1. Chester has the highest at 25.4 to 1.
Teacher Retention
Statistically speaking, teacher retention appears to be an issue for Fairfield, according to report card data.
Fairfield’s percentage of teachers on continuing contract is lowest (63.2 percent) of the seven districts. The six surrounding districts range between 75 percent and 81.6 percent, with Union County leading the pack even though it has the third highest percentage of students in poverty and the second lowest average teacher salaries according to report card data.
Fairfield falls in the middle in average teacher salaries at $49,288. Richland Two leads at $51,802, followed by Kershaw at $51,631.
Newberry trailed all seven at $46,575 despite its schools receiving comparatively high ratings.
Other average salaries by district include: Union, $47,750; Chester, $49,019; and Lancaster, $49,413.
All Report Card data is available online at https://ed.sc.gov/data/report-cards/sc-school-report-card/


Congrats to Fairfield’s magnent school. However, the FCSD Board should investigate the correlation between Faifield’s relatively low percent of classroom and teacher expenditures and it’s low percent of teachers on continuing contract.